
System Sit, check on the system with a quick glance!
![]()
cargo install sysit
System resources overview within 40 characters. Relies on sysinfo to get all the relevant system information.

``` sysit Get system resources overview in 40 characters. For usage details, try --help
USAGE: sysit [FLAGS] [OPTIONS]
FLAGS: -c, --colors force output to be always colorized -h, --help Prints help information -l, --log run in log mode (will continuously append a row to standard output) --no-colors force output to be never colorized -V, --version Prints version information -w, --watch run in watch mode (will act as if running with the watch)
OPTIONS:
-i, --interval
    --threshold-cpu-high <threshold-cpu-high>
        the threshold for high cpu usage (higher values will be rendered in red) [default:
        80.0]

    --threshold-cpu-medium <threshold-cpu-medium>
        the threshold for medium cpu usage (higher values will be rendered in yellow) [default:
        50.0]

    --threshold-memory-high <threshold-memory-high>
        the threshold for high memory usage (higher values will be rendered in red) [default:
        80.0]

    --threshold-memory-medium <threshold-memory-medium>
        the threshold for medium memory usage (higher values will be rendered in yellow)
        [default: 50.0]

    --threshold-temp-hot <threshold-temp-hot>
        the threshold for high temperature (higher values will be rendered in red) [default:
        75.0]

    --threshold-temp-warm <threshold-temp-warm>
        the threshold for warm temperature (higher values will be rendered in yellow) [default:
        55.0]
```
When working headlessly with tmux or even when working on a desktop,
being able to quickly see basic system informatino can be useful.
There's btm (also based on sysinfo, heim), but you have to
actively switch to them.
For instance, when overclocking the RPi, it makes sense to monitor the CPU frequency and temperature. Inspired by cpu-temp-speed on Manjaro, which has been quite useful in tuning the overclock and colling system configuration.
Simply type sysit for a quick glance at the system information.
rohan in mir in sysit on master is 📦 v0.1.0 via 🦀 v1.49.0
at 17:45:13 ❯ sysit
M: 8% | C: 0% @ 1100 MHz | T: 54°C
This can also be used with a desktop manager's applets. For example,
Xfce's genmon.
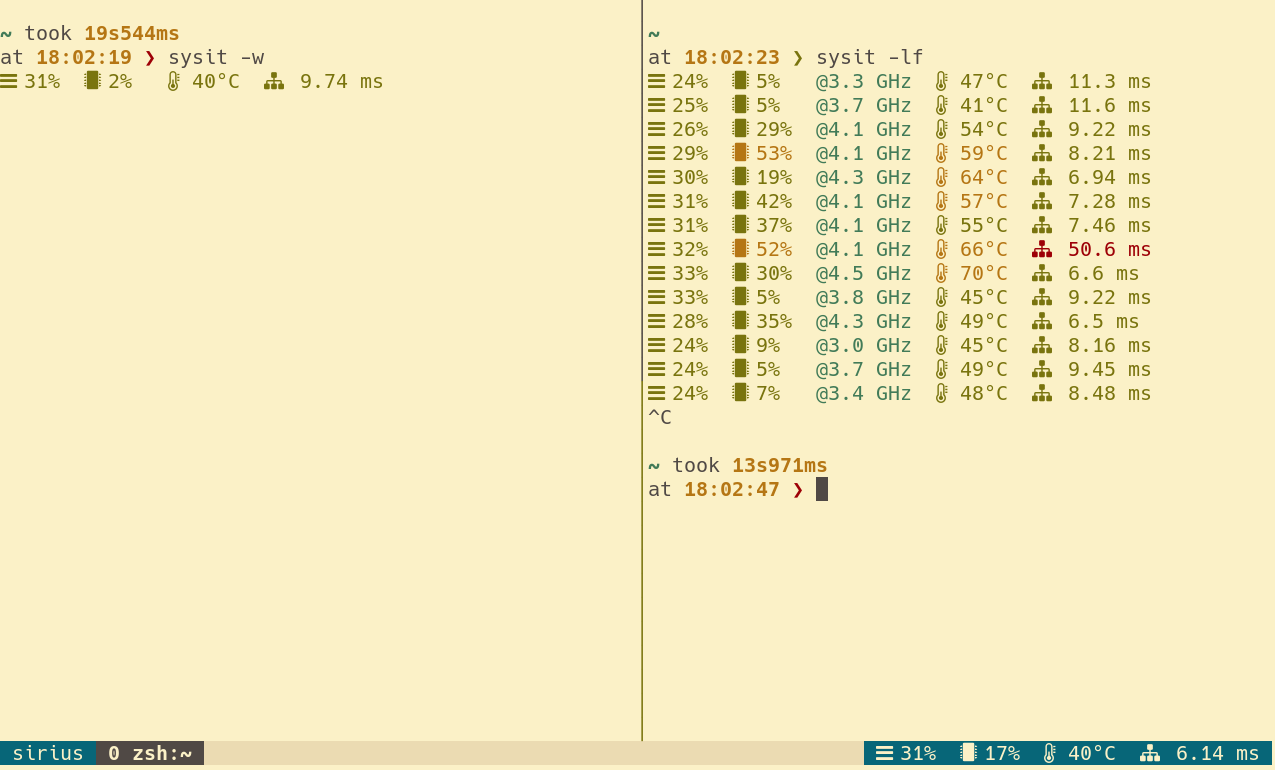
Works as if watch sysit. Can be used within tmux status line for
continuous monitoring. Eg:
tmux.conf
set -g status-right '#[fg=yellow] #(sysit -wi 2) #[fg=colour235,bg=colour252,bold] %a %d %b %H:%M:%S #[fg=colour252,bg=colour238,nobold]#[fg=colour245,bg=colour238,bold]'
Watch mode with sysit -wi 2 has a benefit of maintaining a single
process. Just using plain sysit command will also work, but that'd
mean tmux spawns a new process every time.
At times it can be handy to log system stats, for instance, while
benchmarking.
rohan in mir in sysit on master [?] is 📦 v0.1.0 via 🦀 v1.49.0
at 19:22:44 ❯ sysit -li 1
M: 11% | C: 0% @ 675 MHz | T: 55°C
M: 11% | C: 2% @ 600 MHz | T: 54°C
M: 11% | C: 87% @ 2100 MHz | T: 56°C
M: 11% | C: 100% @ 2100 MHz | T: 60°C
M: 11% | C: 100% @ 2100 MHz | T: 63°C
M: 11% | C: 100% @ 2100 MHz | T: 61°C
M: 11% | C: 0% @ 600 MHz | T: 59°C