
![]()
![]()
![]()
Benchmarking tool for network services. Currently, limited to HTTP only (H1 or H2, over TCP or TLS). However, it's easily extendable to other protocols.
It works in the following modes:
ab-like mode. Just send traffic to an endpoint for a given duration, or a number of requests.
µs.1,000 every minute to see how your service scales with load.Prometheus via a pushgateway.For instance: 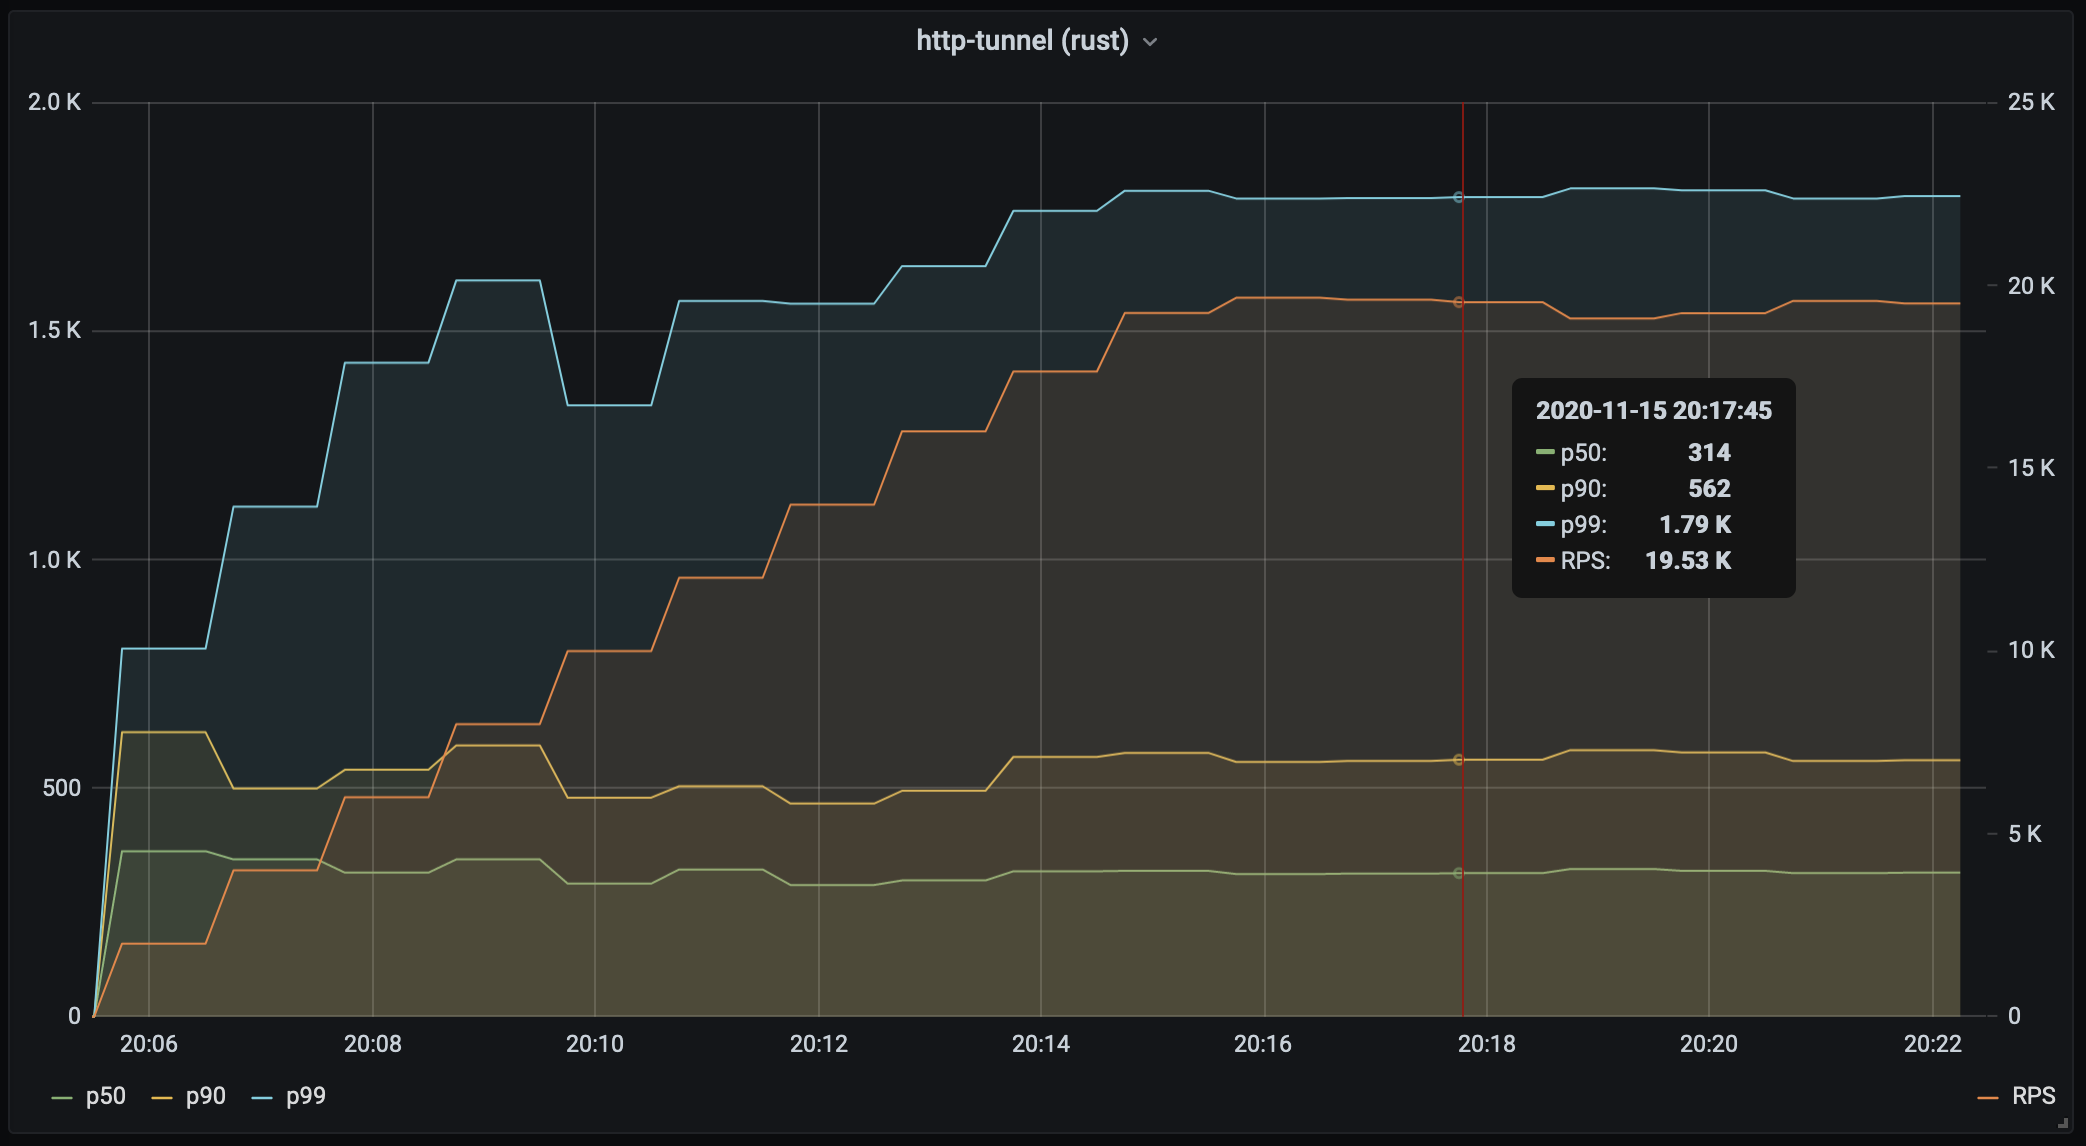 .
.
Emitted metrics are:
* request_count - counter for all requests
* success_count - counter for only successful requests
* bytes_count - total bytes transferred
* response_codes - counters for response codes (200, 400, etc.)
* success_latency - latency histogram of successful requests only
* error_latency - latency histogram of failed requests (if any)
* latency - latency histogram across all requests
* latency_{statistic} - {statistic} = {min, mean, max, stddev, p50, p90, p99, p99_9, p99_99} - gauges for latency statistics
You can read more here.
Install cargo - follow these instructions.
On Debian to fix OpenSSL build issue. E.g. on Debian:
sudo apt-get install pkg-config libssl-dev
on Red-Hat:
```
sudo dnf install pkg-config openssl-devel
sudo yum install pkg-config openssl-devel ```
Then: ``` $ cargo install perf-gauage $ perf-gauge help
A tool for gauging performance of network services
USAGE: perf-gauge [OPTIONS] [SUBCOMMAND]
FLAGS: -h, --help Prints help information -V, --version Prints version information
OPTIONS:
-c, --concurrency 1.
-d, --duration 1. Requires --rate-step
    --noise_threshold <NOISE_THRESHOLD>
        Noise threshold (in standard deviations) - a positive integer. By default it's `6`,
        which means latency deviated more than 6 stddev from the mean are ignored

-n, --num_req <NUMBER_OF_REQUESTS>         Number of requests.
    --prometheus <PROMETHEUS_ADDR>
        If you'd like to send metrics to Prometheus PushGateway, specify the server URL. E.g.
        10.0.0.1:9091

    --prometheus_job <PROMETHEUS_JOB>      Prometheus Job (by default `pushgateway`)
-r, --rate <RATE>
        Request rate per second. E.g. 100 or 0.1. By default no limit.

    --rate_max <RATE_MAX>                  Max rate per second.
    --rate_step <RATE_STEP>                Rate increase step (until it reaches --rate_max).
-N, --name <TEST_CASE_NAME>
        Test case name. Optional. Can be used for tagging metrics.
SUBCOMMANDS: help Prints this message or the help of the given subcommand(s) http Run in HTTP(S) mode ```
Help for the http command:
``` $ perf-gauge help http
Run in HTTP(S) mode
USAGE:
perf-gauge http [FLAGS] [OPTIONS]
ARGS:
FLAGS: --connreuse If connections should be re-used --http2only Enforce HTTP/2 only --ignorecert Allow self signed certificates. Applies to the target (not proxy). --storecookies If cookies should be stored -h, --help Prints help information -V, --version Prints version information
OPTIONS: -B, --body
Body of the request in base64. Optional. -H, --headerFor example, test an endpoint using a single run, 5 seconds (max possible request rate):
``` $ perf-gauge -c 4 -d 5s \ http https://my-local-nginx.org/10kb --ignorecert --connreuse Duration 5.005778798s Requests: 99565 Request rate: 19890.012 per second Total bytes: 995.6 MB Bitrate: 1591.201 Mbps
Summary: 200 OK: 99565
Latency: Min : 137µs p50 : 191µs p90 : 243µs p99 : 353µs p99.9 : 546µs p99.99 : 1769µs Max : 15655µs Avg : 201µs StdDev : 110µs ```
Another use case, is to increase request rate and see how the latency degrades.
E.g. increase RPS each minute by 1,000:
``` perf-gauge -c 2 --rate 1000 --ratestep 1000 --ratemax 20000 \ -d 60s \ -N http-tunnel --prometheus localhost:9091 \ http https://my-local-nginx.org/10kb \ --connreuse --ignorecert \ --tunnel http://localhost:8080
```
For example, running the same test in parallel to compare different use-cases:
```bash
perf-gauge -c 1 --rate 1 --ratestep 1000 --ratemax 5000 \ -m 5 -d 60s -N http-tunnel --prometheus localhost:9091 \ http https://my-local-nginx.xnuter.org/10kb \ --connreuse --ignorecert --tunnel http://localhost:8080 &
perf-gauge -c 1 --rate 1 --ratestep 1000 --ratemax 5000 \ -m 5 -d 60s -N nginx-direct --prometheus localhost:9091 \ http https://my-local-nginx.xnuter.org/10kb --connreuse --ignorecert &
```